Este artículo solo está disponible en inglés.
A Deeper Understanding 13: Your Pie Chart Isn't Ready for AI
· — Doug Breckenridge, Co-Founder of Vujade™ and Cabo™
13: A Deeper Understanding
Your Pie Chart Isn’t Ready for AI
Whichever side you take in the AI debate (“AI is good” or “AI is bad”), one thing is certain: AI brings far more complex data. Some people see that complexity as a problem. I see an opportunity and a challenge. Unfortunately, with this much data, the simple pie chart doesn’t cut it to represent complex data.
Back to Basics
Design has always been a serious subject for me, and I belong to the Jobsian school:
“Design is not just what it looks like and feels like. Design is how it works.” — Steve Jobs
My first startup, The Business Workshop, launched in the early 1990s in New Delhi, India. We were an Organizational Development and Learning and Development firm, and it was a right-place, right-time opportunity: we were building custom training programs for Fortune 500 companies expanding across Asia. Most firms leaned on clip art. I couldn’t. I was exhausted by PowerPoint after PowerPoint filled with silly graphics and dizzying transitions that had only a tangential relationship to the content. Our principle was that graphics had to truly represent the content, a symbiosis of form and function. They also had to be simple, elegant, even minimalist. We’ve all heard “Less is more.” In design, I live by this principle.
So, we set out to build a design team. Plenty of candidates had computer skills, but few had real artistic ability, and some simply rearranged clip art. After many fruitless interviews, we realized recruiters weren’t going to find our people. We posted a flyer at the Delhi School of Art instead, and two remarkable artists, Sopphia and Himani, responded. Each had her own strengths, and both could take a vague idea and visualize an entire tapestry of graphics. The one catch was that neither had really used a computer. We knew we could fix that, and both became extraordinary contributors. Teaching an artist to use a computer is far easier than finding a true artist.
Their work was inspirational! We obsessed over details and stripped away anything that distracted from the message. We focused on white space, Pantone™ color combinations, and visuals that embodied our three F’s: Form Follows Function. It was a lot of work, which brings me to another Jobs quote:
“That’s been one of my mantras: focus and simplicity. Simple can be harder than complex. You have to work hard to get your thinking clean to make it simple.” — Steve Jobs
Fast Forward 30 Years: Simplifying Complex AI Data
AI is ushering in an explosion of data. As we neared completion of the Vujade™ algorithms, we were inundated with trillions of data points. At first I was ecstatic. More data meant more detail, and more detail meant greater understanding. That’s still one of the joys of Vujade™: with so much data, we’re at the cutting edge of understanding human behavior. But soon the volume became a frustration.
Vujade™ has three primary constructs and seven subconstructs:
- Sensory: Kinesthetic, Auditory, and Visual
- Temperament: Introvert and Extrovert
- Cognitive: Process and Outcome
Our goal was a single, simple graphic that could show everything. A pie chart can show one construct and its parts, but squeezing in the others gets confusing. Bar charts have the same problem. A quadrant grid compares two factors but can’t handle a third unless you make it a 3D cube. I spent an inordinate amount of time rendering cubes, only to learn they were hard to render and, more importantly, unfamiliar to the average user.
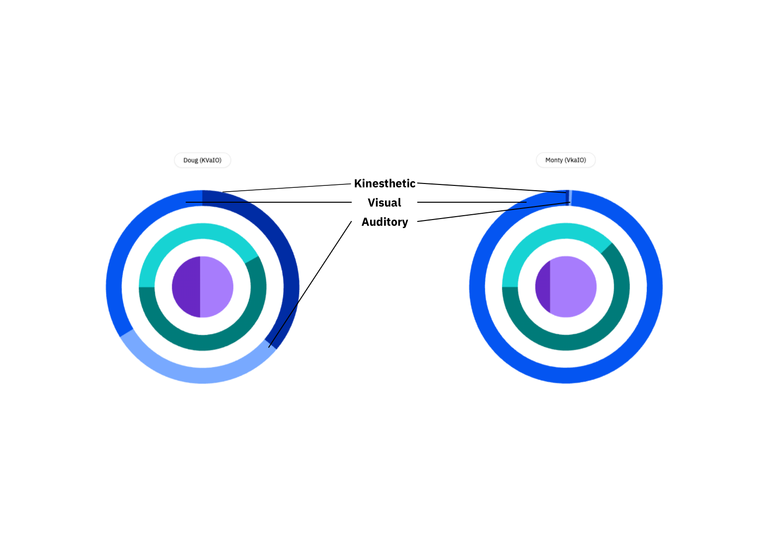
I’d love to say a lightning bolt of inspiration struck, but it didn’t. Over nine months I kept returning to the problem and concluded I had to revisit all my earlier work. I went back to pie charts and sweated every detail, with little progress. Then I wondered about layering pie charts on top of each other. I went to bed exhausted, and the next morning the answer was in my mind: a single pie chart in the center, surrounded by radial rings. Eureka! One simple graphic that shows everything at a glance.
It still took months to settle the order of the rings:
- Sensory is on the outside, because it’s how we first encounter people.
- Temperament comes next, because it’s how we react (or don’t immediately react) to others.
- Cognitive is at the center, as the next logical step in how we process information.
What makes it unique is that each segment adjusts to show how much of each subconstruct is present. You aren’t just one subconstruct (say, “Kinesthetic”). You’re a combination of all of them. In the example below, my Sensory preferences are fairly Integrated, while my business partner Monty is Extraordinarily Visual.
“What’s This?”
Last month I wrote about our journey to our US utility patent in three articles:
- Why HR Doesn’t Produce Many Patents
- Right Place, Right Time, Wrong Answer, Right Question
- Standard Deviation, Novel Innovation
Because we’re based in the Bay Area, I asked the Silicon Valley legal community for patent attorney referrals. After meeting several, we chose Josh Van Hoven and his team, who came highly recommended. There’s an old saying, “You get what you pay for!” The cheapest option isn’t always best. Paying a little bit more can deliver extraordinary value. Patent counsel is one place we didn’t skimp.
Monty and I met with Josh and, after the pleasantries, walked him through our approach to relational, comparative assessments (which became our second patent I wrote about last month). While we were reviewing data and diagrams, Josh spotted our radial and asked, “Why aren’t we patenting that design?”
Monty and I looked at each other, surprised. “Can we patent that?” I asked. “Absolutely,” Josh said. He had done extensive patent work for Silicon Valley tech companies and had never seen anything like it. He immediately suggested a second, “Design” patent, and helped us extend the idea to even more radials around the original Vujade™ radial, so we can display more complex data as we bring other instruments to our Cabo™ platform. Last month we celebrated the first anniversary of this first patent, and the radial now illustrates 9.85 trillion individual options in one simple graphic.
That’s the story of our first patent. More importantly, we’re excited about AI because it lets us add more concentric rings to the Vujade™ radial and extend more data across many constructs within one simple graphic.
— Doug Breckenridge, Co-Founder of Vujade™ and Cabo™
****
Join Us
Register for a free online session with Vujade™’s co-founders on Thursday, October 22, 2026, to discuss our design principles. Geek out with us on the Vujade™ radial, minimalism, our color palettes, white space, and more. We look forward to your questions!